Setting KPIs that drive impact.
Plus five rhythms to nail them

KEVIN L. BROWN
Here’s a two-question thought experiment. Do you know exactly what you should do today in order to achieve your grand vision a few decades from now? And would you know whether your activities this week or quarter were successful in driving impact?
You should be able to answer yes to both. And key performance indicators (KPIs) will be your guide.
KPIs are simply a way of measuring a company’s progress toward the goals it’s trying to achieve. Too often though, this invaluable tool is overcomplicated and misunderstood. Or worse, relegated to the M&E team and finance department because we’re talking about data and numbers.
But here’s the tough love: it’s nearly impossible to achieve a social impact vision without setting and nailing KPIs. Sure, some organizations might stumble upon success without a clear measurement methodology. But those cases are rare and the lucky ones will eventually hit a ceiling.
To be clear, this discussion of KPIs isn’t about monitoring and evaluation of programs, products, or services. Before ever calculating quantitative impact on beneficiaries or customers, there’s a slew of internal measurement metrics that allow an organization to survey progress towards its vision. This is an operational-level approach to aligning teams and actions around what’s important in the short term.
Let’s break it down a bit more. Your vision should translate into long-term targets. Long-term targets become short-term goals. And short-term goals become plans and activities. There’s no point setting a vision if you don’t bring that lofty aim down to earth and track your successes every step of the way.
“If you can’t measure it, you can’t manage it. And what gets measured gets done.”
PETER DRUCKER
Setting KPIs.
There are two types of KPIs: lagging and leading. Both are critical, and you shouldn’t use one without the other.
Lagging indicators are output-oriented measurements used to identify and quantify business performance. Lagging KPIs generally measure what has already happened. These are the stats most people envision when thinking about KPIs: sales or donations, total number of customers/beneficiaries, etc.
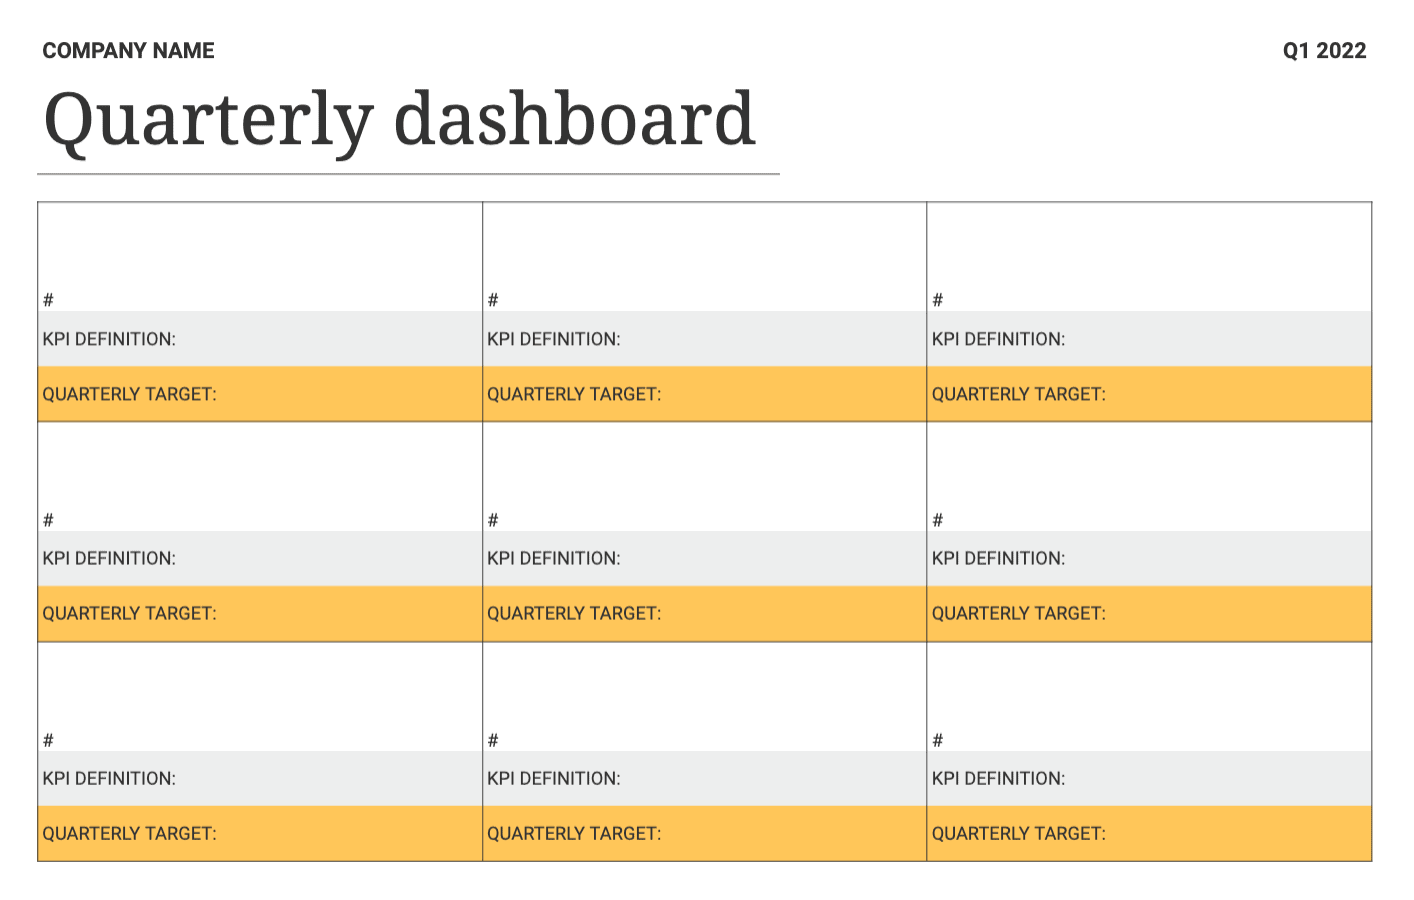
The best way to develop lagging KPIs is to list all the most important results and measures you might put in an investor deck or annual impact report. If all goes as planned, what data would you brag about? While it’s common to brainstorm 15–20 possible KPIs, most organizations should end up with 6–10 they monitor on a regular basis. We recommend putting these lagging KPIs into a dashboard like the one below and reviewing it quarterly.

Bonus points: you should ideally have a buttoned-up annual plan that’s based on your long-term targets. In this case, your quarterly lagging KPIs would be derived directly from what you need to achieve this year. While most of your lagging dashboard categories might remain unchanged for a year or two, you may add/remove a couple of KPIs every few quarters as your business evolves.
Leading indicators, on the other side of the coin, are input-oriented activity metrics that anticipate a company’s progress towards its goals. When done well, leading KPIs are the closest thing your company can have to a crystal ball. This concept takes KPIs a step beyond what most of us are used to seeing on a quarterly dashboard.
To determine leading KPIs, take your 6–10 quarterly lagging KPIs. Then come up with a list of the most critical activities that must happen every week in order to hit your quarterly targets. Imagine if you were on a desert island for a month with no internet or phone. And you only had access to a few activity metrics that came to you weekly via a message in a bottle. What numbers would help you see whether people were doing what they were supposed to be doing, and if your organization was on track or not to achieve your quarterly KPIs? Examples would be weekly activities like number of field visits completed, donor proposals sent, or inbound inquiries on the website.
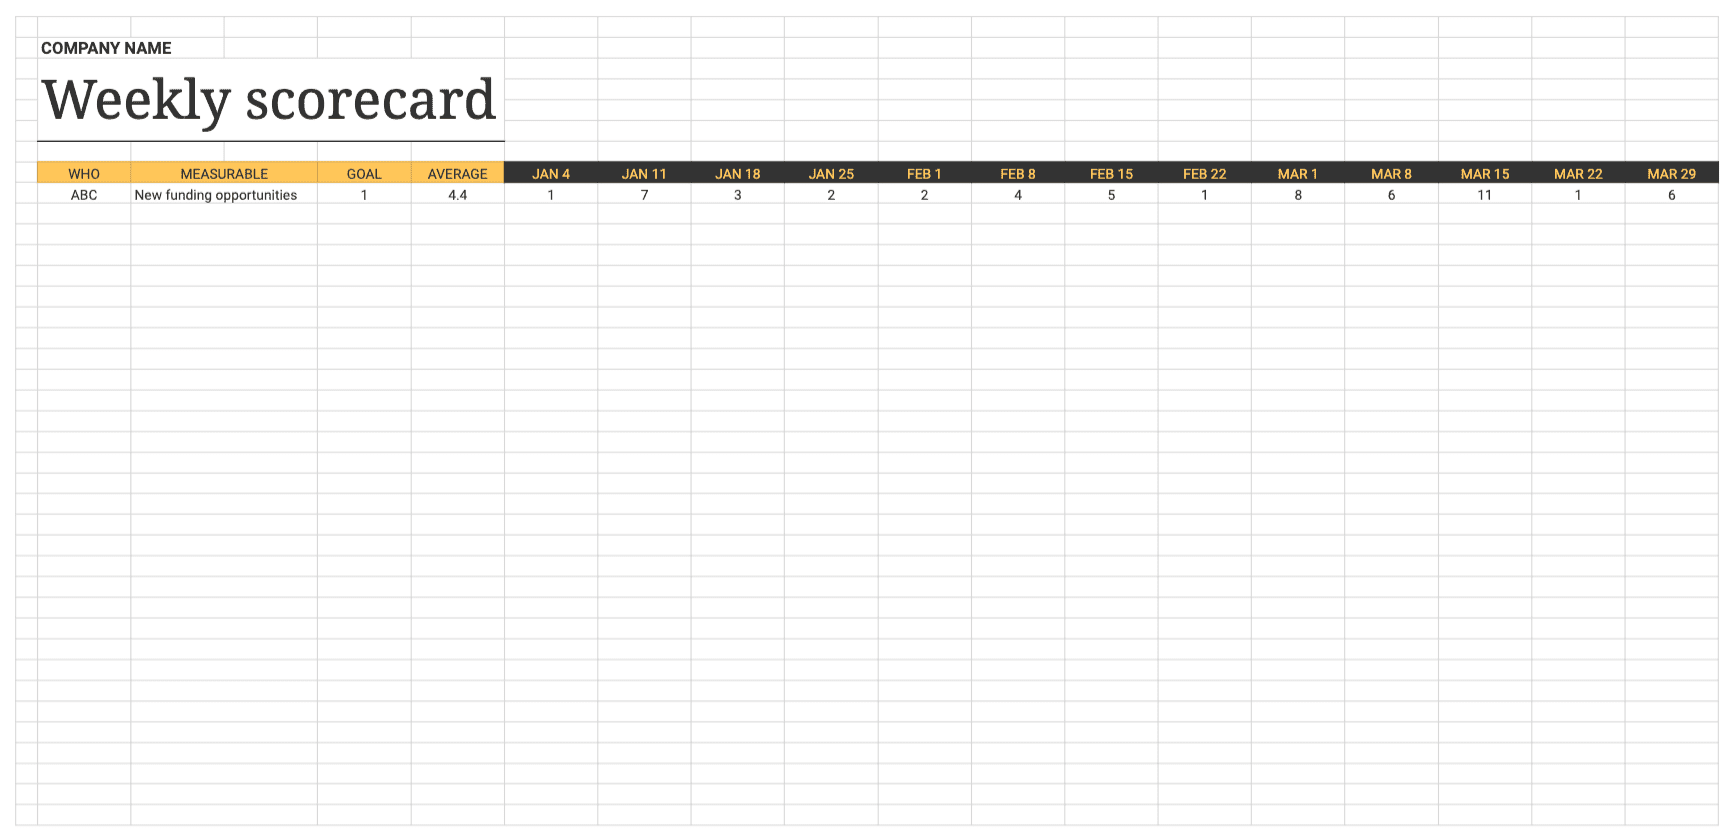
Pick those top 12–15 leading indicators — that ideally roll up to the lagging KPIs — and fill out a scorecard like the one below. The final steps with leading KPIs are to assign a single owner who is accountable for accomplishing that weekly activity (even if others are responsible for some of the work). And then pick a weekly goal to help determine over time whether you’re on track or not. You’ll then see a 13-week rolling average play out across the scorecard in order to identify trends.

These trends are the pivotal reason leading KPIs are so effective in driving impact. Without leading KPIs forecasting what’s to come, you could end the quarter off track on a lagging KPI with no time to effect change. Leading KPIs signal trends over the course of each quarter, and these frequent signals allow you to course correct along the way so there are no surprises when it’s time to count the cash, so to speak.
We just taught a workshop in Kampala at the SHONA institute on this exact topic. We trained a group of high-potential, locally-led social enterprises on KPIs and how to set them. And find the interplay between the lagging indicator dashboard and leading indicator scorecard. A few examples from the Unreasonable cohort show the importance of determining the right KPIs, especially for early-stage social entrepreneurs.
Water Access Rwanda had in its lagging, quarterly KPIs the number of new boreholes dug and liters of clean water sold. That’s where they make money, so these are two solid lagging KPIs that partially made up their dashboard. To reach these quarterly targets, every week they must conduct a certain number of site assessments and geological surveys. Because without these weekly activities of visiting and analyzing potential drilling sites, there would be no boreholes to dig or water to sell.
SmartCore creates and distributes educational content to secondary students in Tanzania. It listed total children reached and number of new digital content modules as its top two lagging KPIs. In order to achieve these quarterly targets, it must meet with prospective district officials each week and create a series of storyboards that set the stage for new video content. Thus, their measurable weekly activities directly support their quarterly impact KPIs.
“Measurement is fabulous. Unless you’re busy measuring what’s easy to measure as opposed to what’s important.”
SETH GODIN
What makes a good KPI?
Now that we’ve covered the basic concepts of lagging and leading KPIs, let’s dissect what makes a good one. It boils down to a clever and trusty acronym: SMART.

First and foremost, a KPI must be specific. This means that an outsider should be able to read the KPI and know exactly what it means. And there should be no ambiguity on your team when debating whether you achieved it or not. We’re shocked to see how often a KPI will be written in broad and meaningless terms, like “Customer satisfaction”. What? Making it specific would look more like, “Average Net Promoter Score among active paying customers”.
Second, a good KPI must be measurable. Pretty obvious, right? But again, we’ll often see companies list an indicator they have no way of measuring. For example, a nonprofit focused on developing life skills for teenage street kids might want to list “Youth empowered” as a KPI. If so, the mandate is on you to find a way to measure empowerment. Like developing a survey you distribute at the beginning, middle, and end of your intervention to quantitatively score your beneficiaries on their life outlook.
Third, it’s important that KPIs are attainable. We’re not trying to stifle stretch goals, because it’s always advisable to set a KPI slightly beyond existing realities. But if you’re currently providing healthcare services to 1,500 patients every quarter, it’s not realistic (or helpful) to set a quarterly target of 150,000 unless you’ve got a multi-million dollar grant coming in. Instead, look at previous average quarterly growth and maybe add 10–20% in order to make your goal both aspirational and attainable.
Next, KPIs should be relevant. This primarily means that weekly leading indicators should match up to your quarterly KPIs, when possible. This also means that all KPIs should pertain to your strategic plan and business conditions. For example, if you’re a nonprofit social enterprise that relies exclusively on product sales and individual donors for funding, you shouldn’t waste a spot on your dashboard with a KPI around impact investing.
And finally, it’s important that all KPIs are time-based. By using a quarterly dashboard and weekly scorecard, you’re inherently putting time constraints on your KPIs. So that’s a great start. But you can think even more specifically about timing requirements if warranted. Let’s say you need $20,000 worth of orders every quarter in order to stay cash flow positive for the next term. But you have net-15 payment terms with these pre-order customers. You might set your lagging KPI around securing orders and billing with 15 days of each quarter’s end.
5 Rhythms to nail them.
We have KPIs, now what? Your KPIs are only as good as your ability to put the measurables into action and make decisions against them.
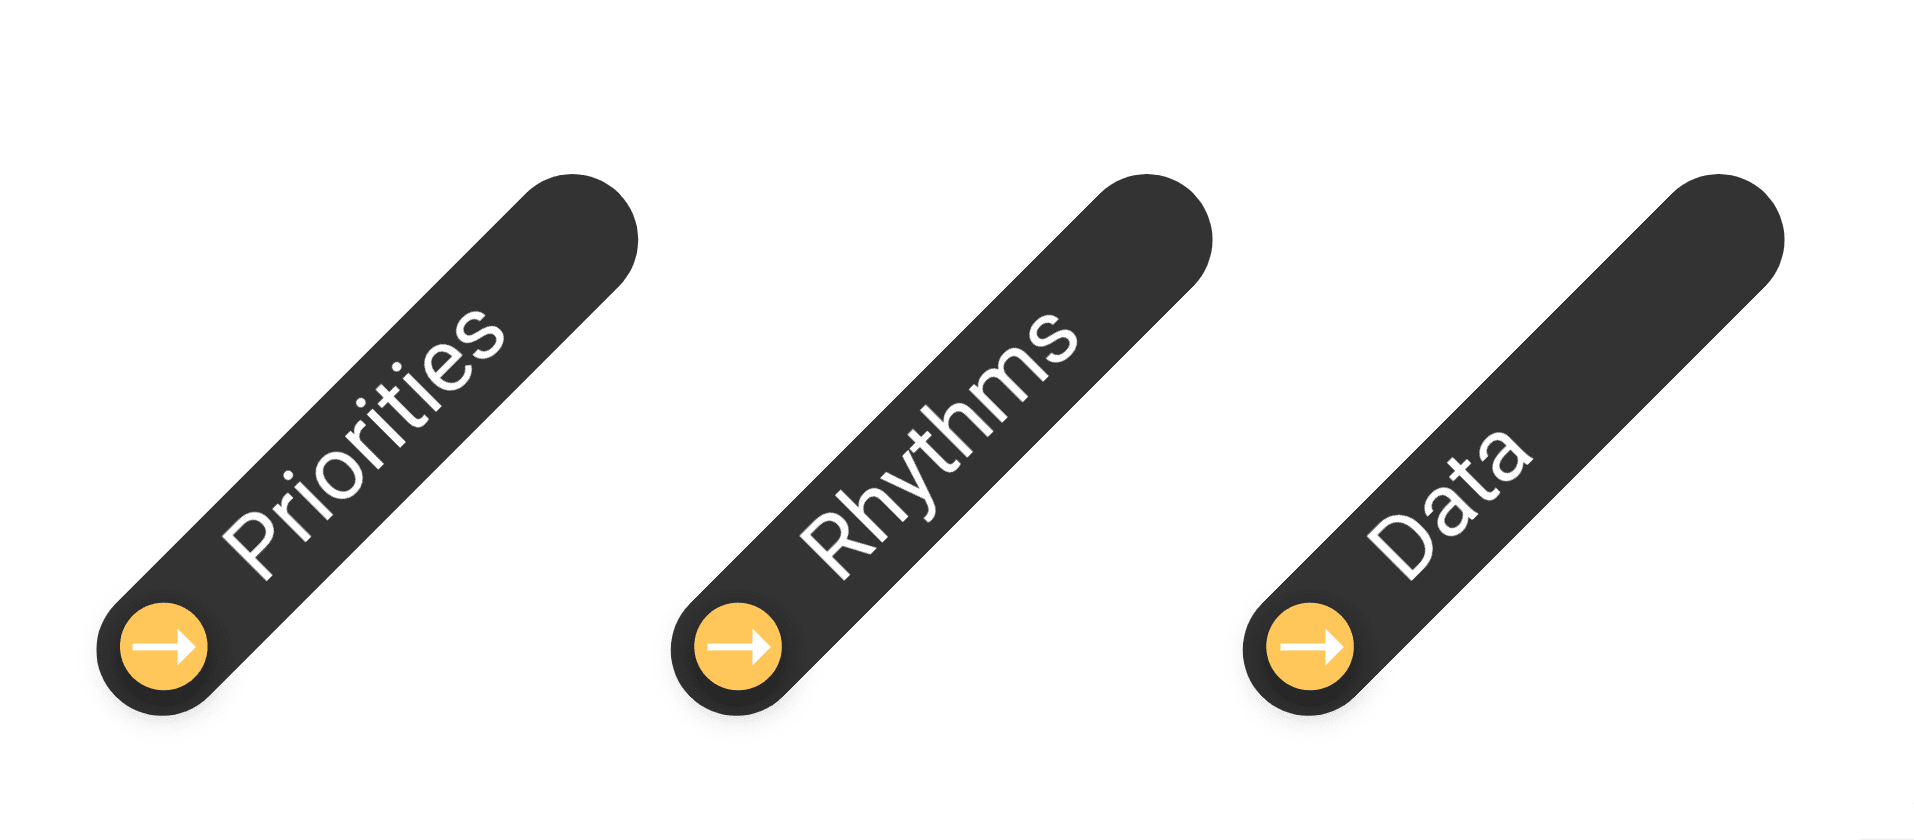
It’s helpful to look at KPIs via the Rockefeller Habits lens. In his illuminating book, Verne Harnish speaks of three habits required to manage and improve a company:

Priorities (step 1) mean strategic planning — determining what to do. Data (step 3) is using KPIs to track what’s working and what’s not (the focus of this article). But it’s the middle step — rhythms — where the magic most often happens. Rhythms are the purposeful way your organization will set out to achieve its KPIs, including facets like people, issues, meetings, and process.
Ace the following five rhythms, and you’re well on the way to nailing your KPIs.
1. Interpersonal dynamics
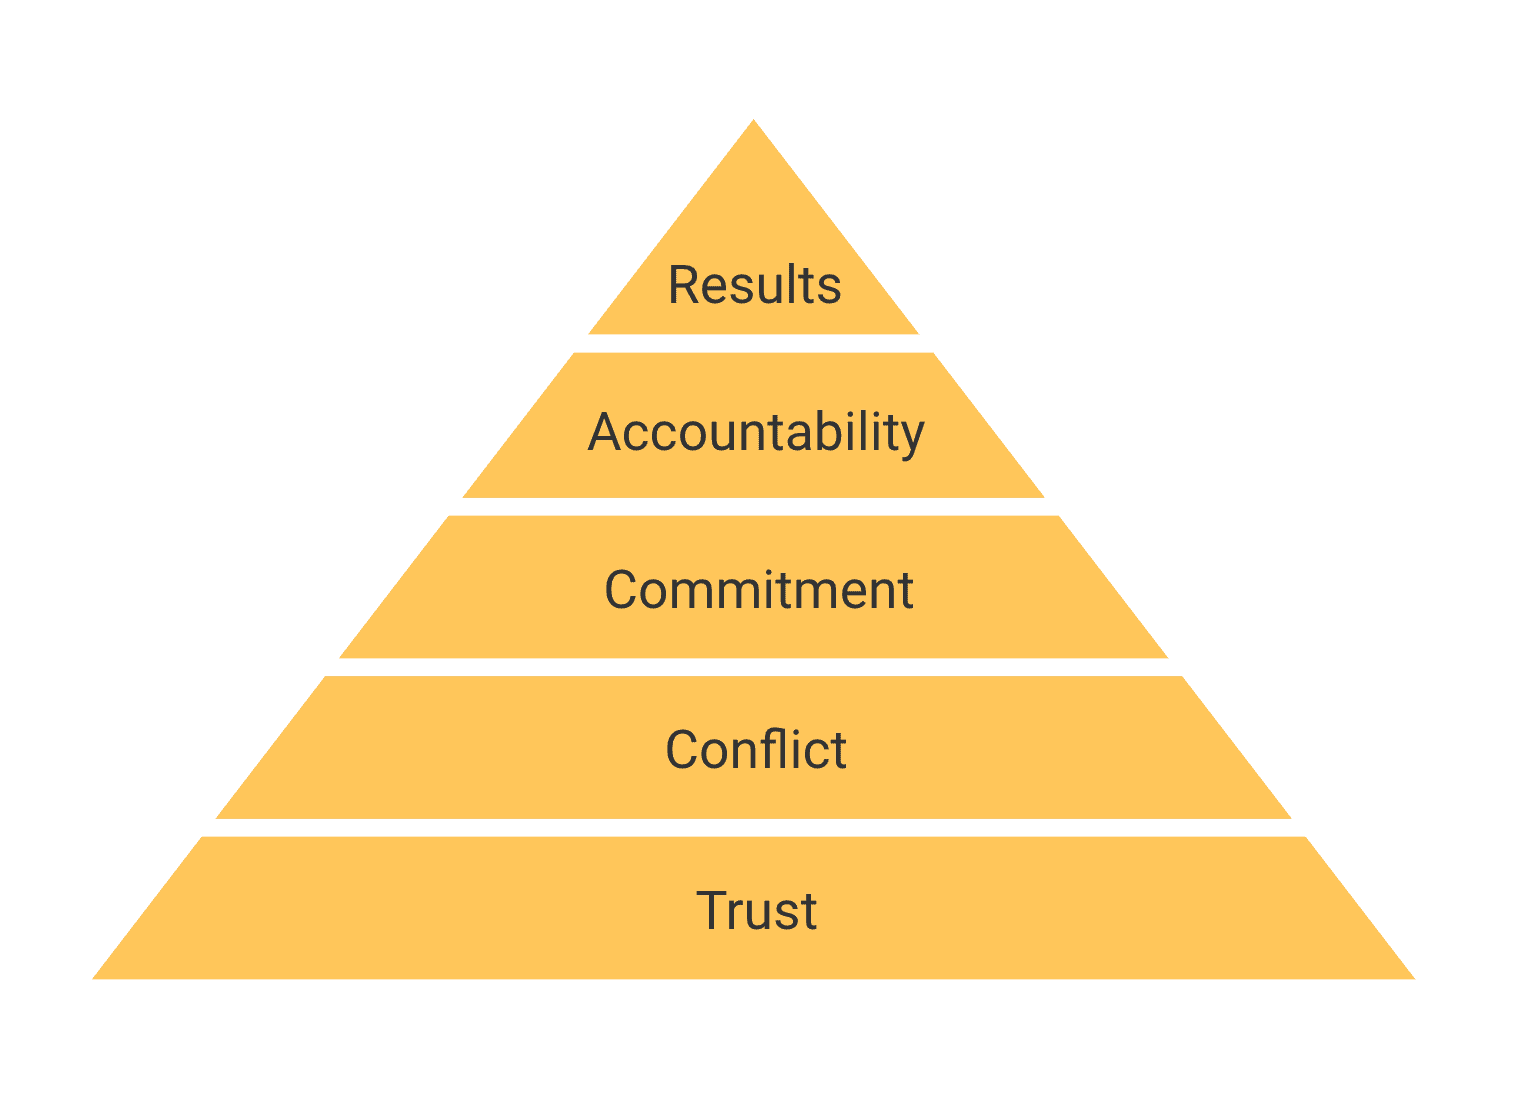
American author Patrick Lencioni believes in Five Dysfunctions of a Team that there are critical layers required within a company before expecting results. The fear of being vulnerable often prevents trust. Without trust, artificial harmony stifles healthy conflict. Lack of conflict prevents teams from making decisions they will commit to sticking to. Without commitment, team members don’t hold each other accountable. And lacking accountability erodes the collective focus on achieving KPIs. Read on to set the foundation for KPI success.

2. Accountability
After interpersonal dynamics are mastered, the next step in nailing KPIs is getting the right people in the right seats. What good is setting measurables and assigning ownership if you’re missing key roles or the wrong people are responsible for the right things? An Accountability Chart is a powerful tool to provide clarity about who owns the major functions of an organization and to identify the primary responsibilities for which they are accountable.
3. Solving issues
It’s inevitable — KPIs will be missed. Even if the targets are correct and the right person is in charge, measurables will go off track. When problems occur around KPIs, how an organization responds and solves issues is paramount. There’s a methodology called IDS aimed at getting to root causes of issues and deciding on solutions. Within IDS, it’s helpful to use a tool called the 5 WHYs to really identify the problem behind the problem. Because when a KPI isn’t achieved, there are likely troubled waters well upstream.
4. Meeting pulse
One of the best ways to enforce accountability around KPIs is to establish (and keep!) a regular meeting pulse. As simple as it sounds, meetings every day, week, quarter, and year provide a pattern of discipline. Meetings are your organization’s heartbeat. They should be on the same day at the same time with a written agenda. Start on time and end on time, with the only excuse to miss being vacation or death. With a cadence of meetings in place, when people aren’t hitting their targets you’ll be aware of it (and have a chance to IDS) long before it can affect downstream KPIs.
5. Process documentation
Even with the previous four rhythms having established both intangible and tangible safeguards around KPIs, some people in your organization will simply need guidance on how to hit your targets (especially lower-level employees). The belief here mirrors Michael Gerber in E-Myth, where he advises to build a business of systems — not people — with people running the systems. There are a number of methodologies for identifying and documenting processes, but the basic idea is this: decide on your 5–7 core processes, write down the top 20% (major steps) that produce 80% of the results, and use checklists when possible. With this system in place, you’re providing guardrails around KPIs and putting an insurance policy on their success.
“Successful businesses operate with a crystal clear vision that is shared by everyone. They have the right people in the right seats. They have a pulse on their operations by watching and managing a handful of numbers on a weekly basis. They identify and solve issues promptly in an open and honest environment. They document their processes and ensure that they are followed by everyone. They establish priorities for each employee and ensure that a high level of trust, communication, and accountability exists on each team.”
GINO WICKMAN
From KPIs to insights and action.
A discussion of KPIs would be remiss without acknowledging that indicators themselves won’t affect a thing. It would be foolish to think a number on a dashboard or scorecard could drive impact in isolation — even if you follow all the advice above.
What a KPI can do though is become your crystal ball. Your truth teller. Your catalyst. Good KPIs can spark conversation and insights. And hopefully, they spark movement in the right direction.
The idea is that data alone is insufficient. Data should lead to reports, reports should lead to analysis, analysis should drive insights, insights turn into recommendations, and recommendations become actions.
With KPIs properly tied to visions of impact ahead, these seemingly small measurables are too consequential to ignore.
There’s hidden meaning behind every KPI. A person to talk to. An experiment to run. A technology decision to make. Or potentially a business model pivot to consider. It’s our jobs as social entrepreneurs to dig in and have the courage to find out what is going on and why. And adjust along the way.
“If you torture the data long enough, it will confess to anything.”
RONALD COASE
Read more articles
Ready to get fundable and findable?
We engage three ways: consulting, training, and field building.
